
Figure 2.
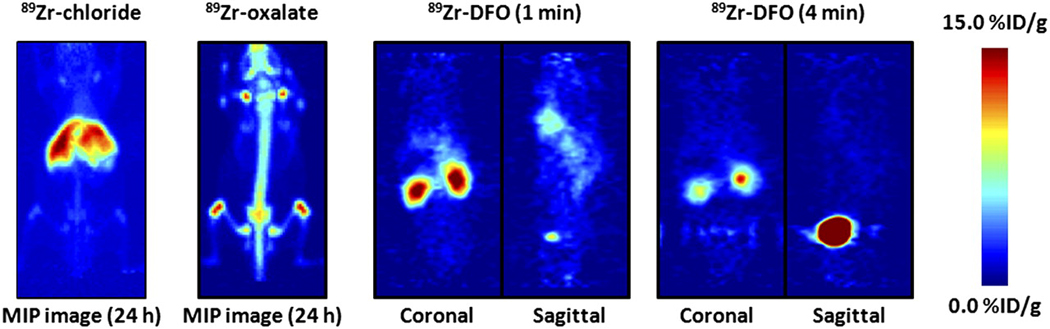
PET images showing maximum intensity projection of 89Zr-chloride and 89Zr-oxalate at 24 h after intravenous administration and dynamic PET images of 89Zr-DFO at 1 and 4 min after injection. For maximum-intensity-projection images, upper and lower intensity thresholds were set at 100% and 0%, respectively. Further details are presented in Supplemental Figures 3–6. MIP = maximum intensity projection.