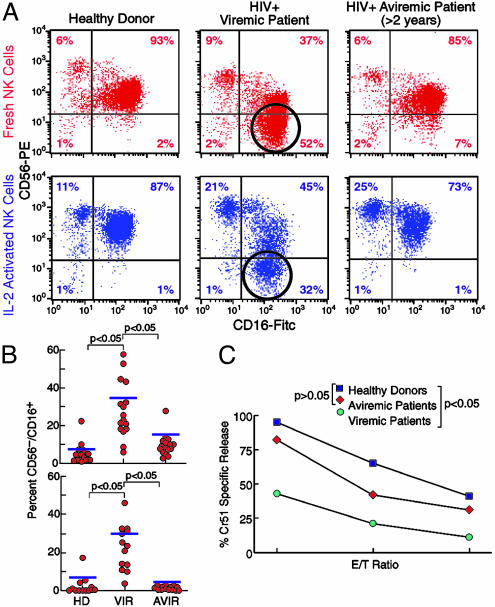
Fig. 1.
Phenotypic analysis and functional capability of NK cells. (A) Double fluorescence cytofluorometric analysis with NK cells stained with CD56 PE/CD16 FITC and characterization of the abnormal CD56-/CD16+ subset in fresh (red dot plots) and activated (blue dot plots) NK cells with statistical analysis. This population is markedly represented in HIV-1-positive viremic patients (open circles) and is very minimally represented in healthy donors and in HIV-1-positive aviremic individuals. (B) Graphs of statistical dot plots showing the percentage of the CD56-/CD16+ NK cells subset (freshly isolated, Upper; activated, Lower) in all of the subjects within the three groups studied with median (blue bars) and P value between the cohorts of healthy donors versus viremic patients and viremic versus aviremic patients. HD, healthy donors; VIR, viremic patients; AVIR, aviremic patients. (C) Spontaneous cytolytic activity of NK cells activated with rIL-2 in vitro for 6 days against K562 cell lines at different E/T ratios (2:1, 1:1, and 0.5:1) (Lower). Averages were calculated on 13 healthy donors (black squares) versus 17 viremic patients (green circles) and 16 aviremic patients (red diamonds) with statistical analysis (Upper).

