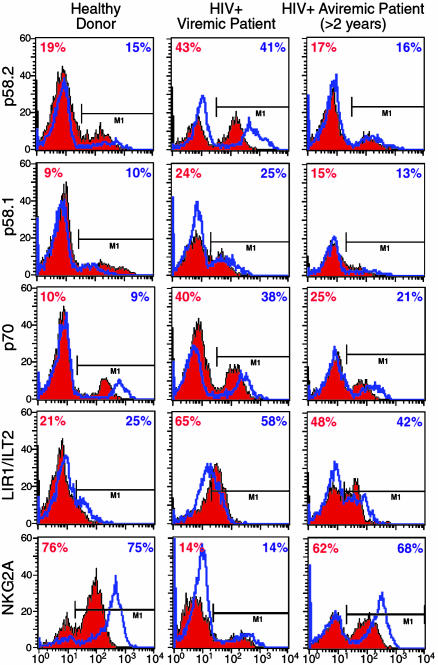
Fig. 2.
Expression of iNKRs. Graphs show cytofluorometric analyses of percent of surface expression on freshly isolated (red histograms) and IL-2-activated (blue lines) NK cells in single representative individuals for 13 healthy donors (Left), 17 viremic patients (Center), and 16 aviremic patients suppressed by HAART for >2 years (Right) of the following iNKRs: p58.2, p58.1, p70, LIR1/ILT2, and NKG2A.

