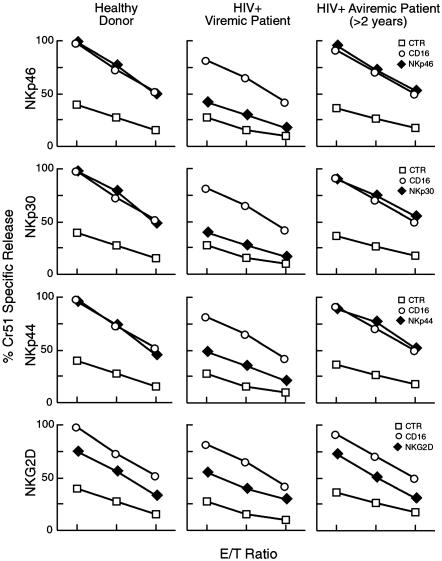
Fig. 5.
Functional evaluation of NCRs and NKG2D. Graphs show the functional evaluation of surface expression of the following activating NK receptors by a redirected killing assay using an FcγR+ P815 target cell line: NKp46, NKp30, NKp44, and NKG2D. Data are presented as an average of all of the data collected from the uninfected individuals (Left), viremic HIV-infected subjects (Center), and aviremic HIV-Infected subjects (Right). E/T ratios are 5:1, 2:1, and 0.5:1. Every graph shows the baseline lysis (open squares), the maximal lysis triggered by anti-CD16 IgG-mAb (open circles), and the killing driven by the relevant activating NK receptors (filled diamonds).

