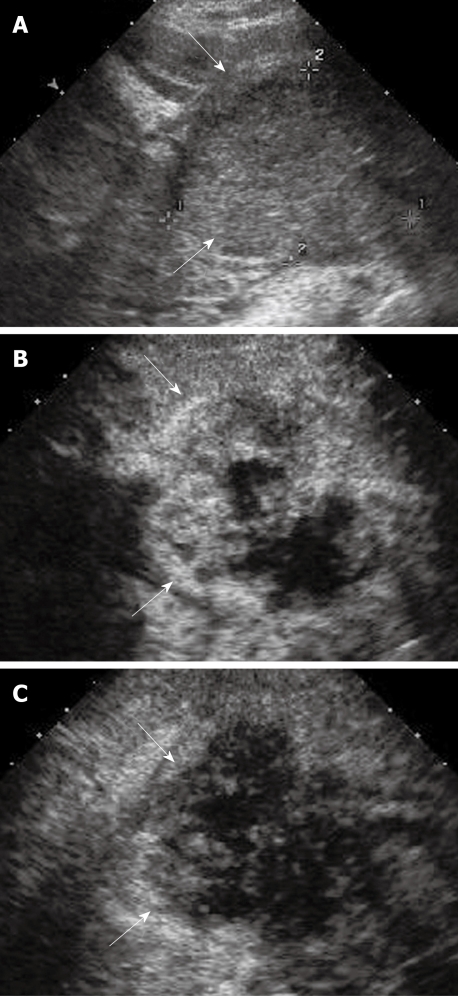
Figure 4.
Intrahepatic cholangiocarcinoma. A: Gray-scale sonogram shows hypo-echoic nodule (arrows); B: At CEUS during the arterial phase the lesion shows markedly inhomogeneous enhancement (arrows); C: The lesion appears as hypo-enhancing mass in comparison with adjacent parenchyma in late phase (arrows).

