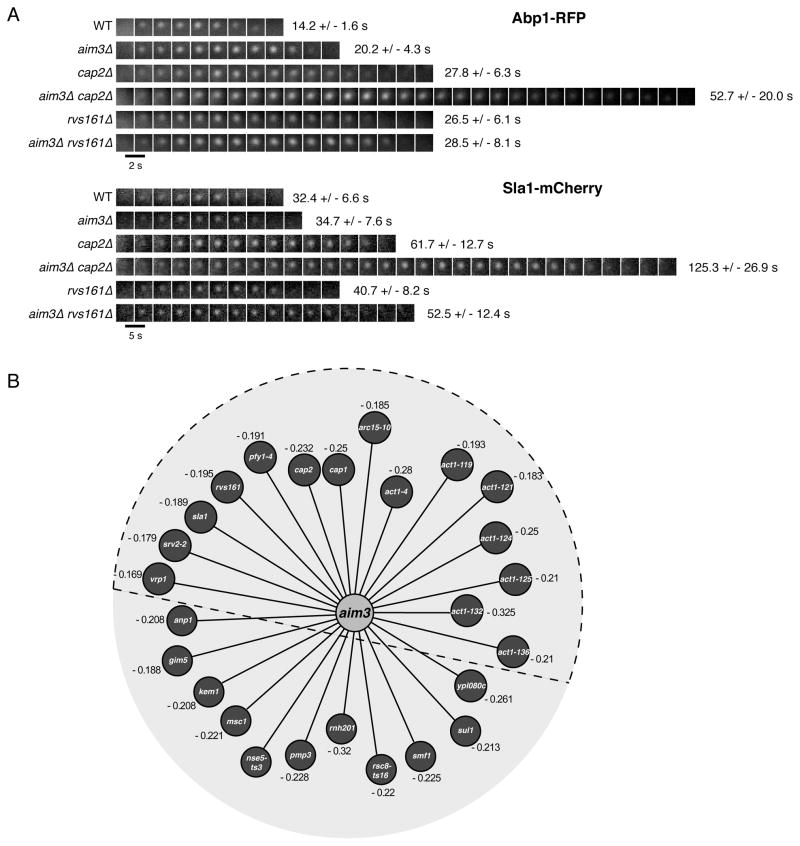
Figure 6. Deletion of Aim3 and its Effects on Actin Patch Dynamics.
(A) Timecourse of representative Abp1-RFP and Sla1-Cherry patches in various strain backgrounds as indicated. Images were captured at the indicated time intervals. Lifetimes are indicated for n = 50 patches for all strains. (B) Genome-wide Synthetic Genetic Array (SGA) screen with an aim3Δ defined confidence threshold (ε < −0.15, p < 0.01). Numbers represent the SGA genetic interaction score ε. Proteins contained within the dashed semi-circle correspond to actin cytoskeleton regulating or interacting proteins. See also Table S4.

