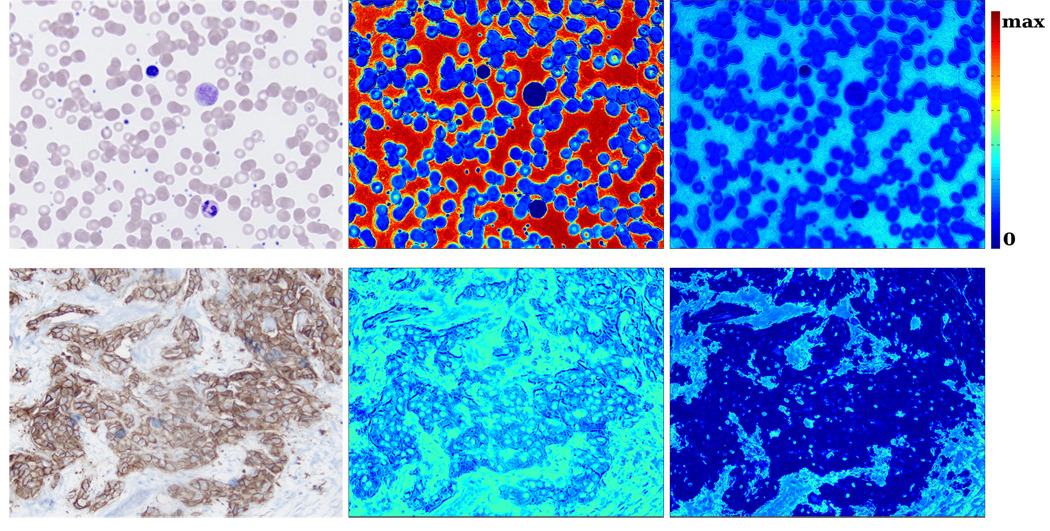
Fig. 4.
Left column: RGB image. Middle column: heatmap of the metameric probability assuming independence. Right column: heatmap generated from the empirical method described in Sec. 3. The empirical values are plotted on a log scale for visualization purposes. The maximum value corresponds to the peak of the probability density function.

