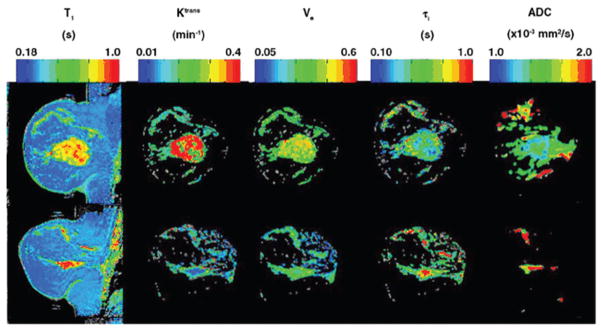
Figure 2.
Pre-treatment and post-treatment parametric mappings of the central slice of the tumour from a representative patient. The top row displays the pre-treatment T1, Ktrans, νe, τi and ADC parametric maps, respectively, while the bottom row shows the corresponding post- treatment maps. In addition to the reduction in tumour size seen in all mappings, relative changes in the distribution of each parameter are visible. Most noticeable is the large drop in the fraction of red pixels on the Ktrans map, indicating a decrease in tumour vessel perfusion and/or permeability; the increase in the ADC map indicates a more geometrically favourable water diffusion environment (reproduced with permission from Yankeelov et al. [102]).

