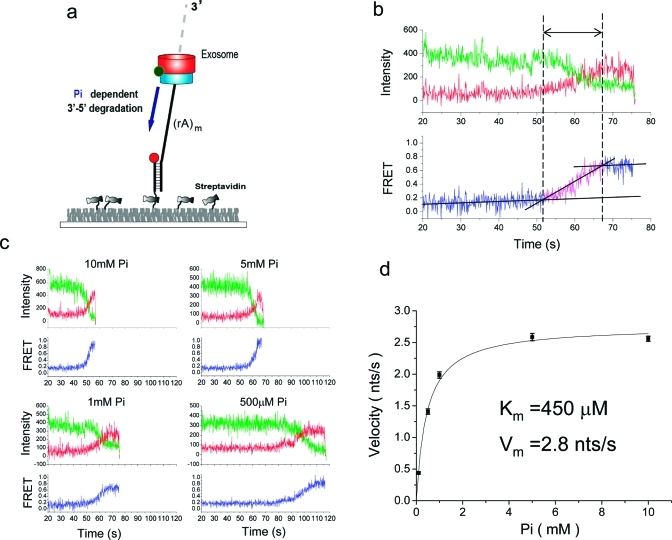
Figure 3.
Processive degradation. (a) In the presence of Pi the exosome approaches the junction via degradation, resulting in an increasing FRET. (b) A representative trace shows how the degradation time is determined. A time interval was measured between when FRET starts to increase and when it saturates to the highest value. (c) Representative traces for various Pi concentrations. (d) The Michaelis−Menten curve for the degradation was calibrated using the relative velocity at 10 mM ADP and 10 mM Pi. The Pi concentration of half-maximum velocity (Km) and the maximum velocity (Vmax) were 450 μM and 2.8 nt/s, respectively.

