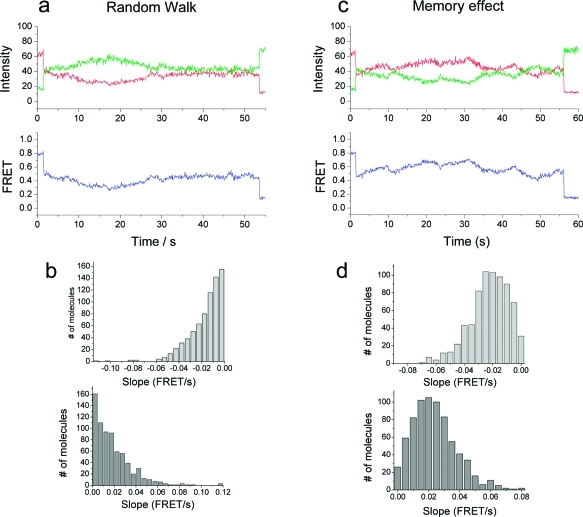
Figure 6.
Simulation of exosome activity. (a, b) Simulation results for the random walk model. A representative FRET time trace (a) and histograms of slope (FRET vs time) for polymerization (b, top) and for degradation (b, bottom). (c, d) Simulation results for the memory effect model. A representative FRET time trace (c) and histograms of slope (FRET vs time) for polymerization (d, top) and for degradation (d, bottom).

