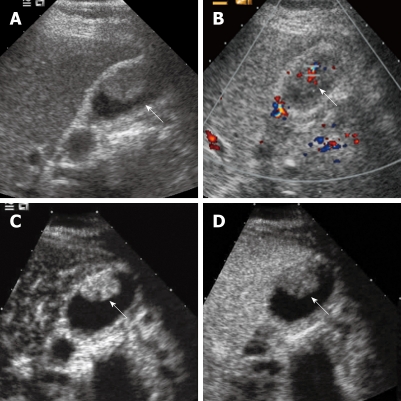
Figure 3.
Gallbladder carcinoma. A: Baseline ultrasound shows an isoechoic mass (arrow) in the gallbladder cavity; B: The lesion (arrow) shows hypervascularity on color Doppler flow imaging; C: The lesion (arrow) shows homogeneous hyper-enhancement 19 s after contrast agent injection on CEUS; D: The lesion (arrow) becomes hypo-enhanced 34 s after contrast agent injection.

