
Figure 2.
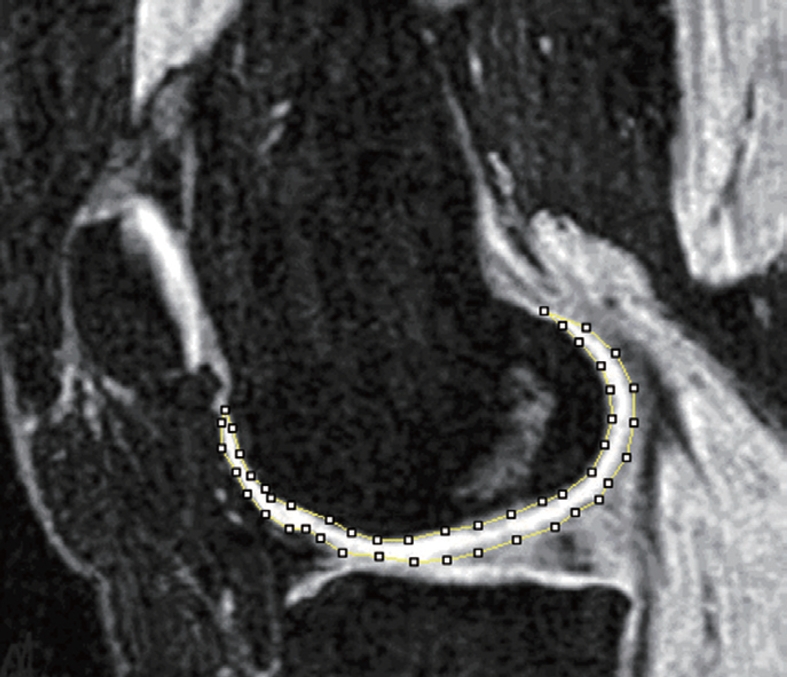
3D GE fat suppressed magnetic resonance imaging (MRI) at the sagittal plane. Bone cortex, bone marrow, and fat tissue appear to have a dark signal. Muscle appears to have a gray signal and cartilage a bright signal. The femur cartilage has been manually segmented at this slice.