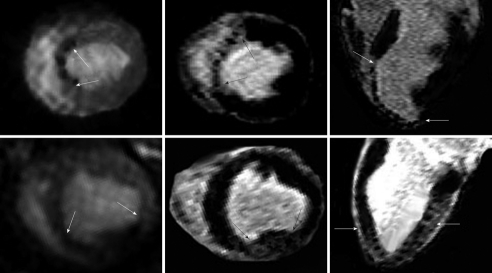
Figure 10.
Preclinical study shows the patchy enhanced embolized region in two animals after delivery of embolic materials (7200 microsphere count, 100-300 μm diameters). Animal one received the embolic materials in the left anterior descending coronary artery causing perfusion deficit in the antero-septal wall 2-3 h after delivery of the embolic materials (top left, arrows), while animal two received the embolic materials in the left circumflex coronary artery causing perfusion deficit in the inferior wall (bottom left, arrows). Short (center images) and long (right images) axis views of DE-MR imaging illustrates the microinfarct of the same ischemic territory 7 d after embolization[114].

