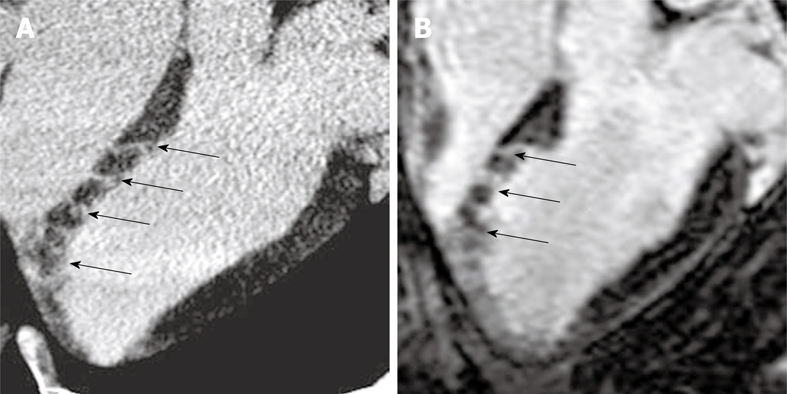
Figure 11.

DE-multi-slice MDCT (A) and DE-MR (B) images from experimentally embolized LAD coronary artery show good correspondence between the modalities in defining heterogenous microinfarct. Both modalities show enhanced stripes (arrows) of microinfarct extending from the epicardium to the endocardium mapping occluded microvessels.
