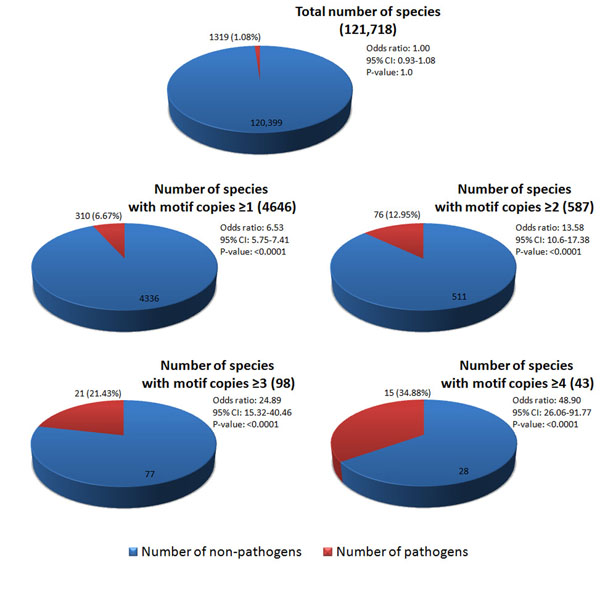
Figure 2.
Relationship between number of EPIYA motif copies and number of species in known pathogens The p-values are calculated from chi-square test statistic between the group and the control (the total with all the species as the background). The list of pathogens is shown in Table 4

