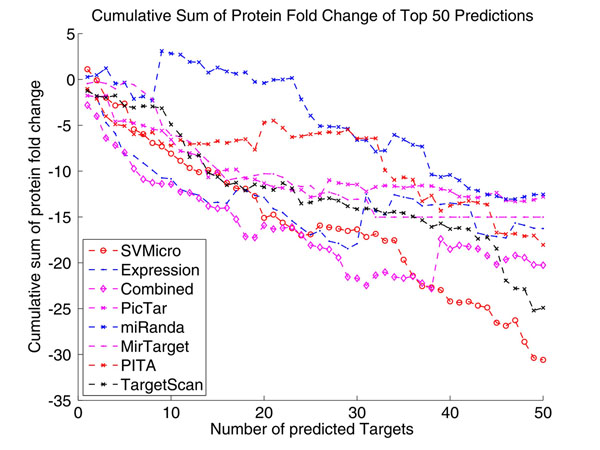
Figure 7.
Cumulative Sum of Protein Fold Change of Top 50 Predictions of hsa-miR-124 This figure shows the result for the top 50 predictions, which indirectly reflects the prediction precision. Particularly, the approach "Expression" uses simply mRNA expression as a score and ranks the larger down-expressed gene higher in the list. We note from Figure 7 that the proposed approach (Combined) achieves the highest amount of protein level down-fold for the top 35 predictions, which indicates higher precision of the proposed approach.

