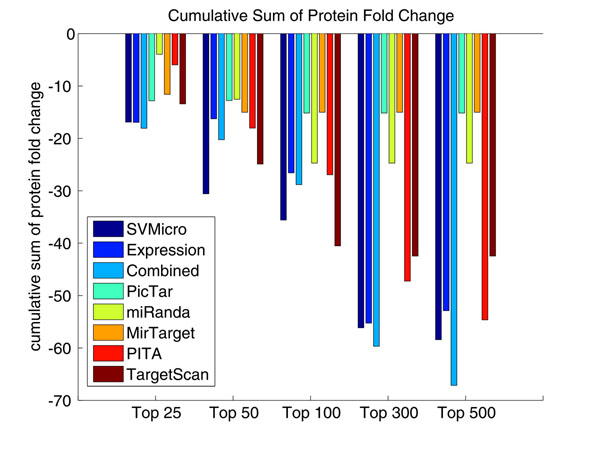
Figure 8.
Cumulative Sum of Protein Fold Change for Different Number of Top Ranked Predictions of hsa-miR-124 The cumulative sum of different numbers of top predictions for several algorithms are depicted. This figure shows that, after top 50, the proposed algorithm has the largest down fold, which also suggests higher sensitive for the proposed algorithm.

