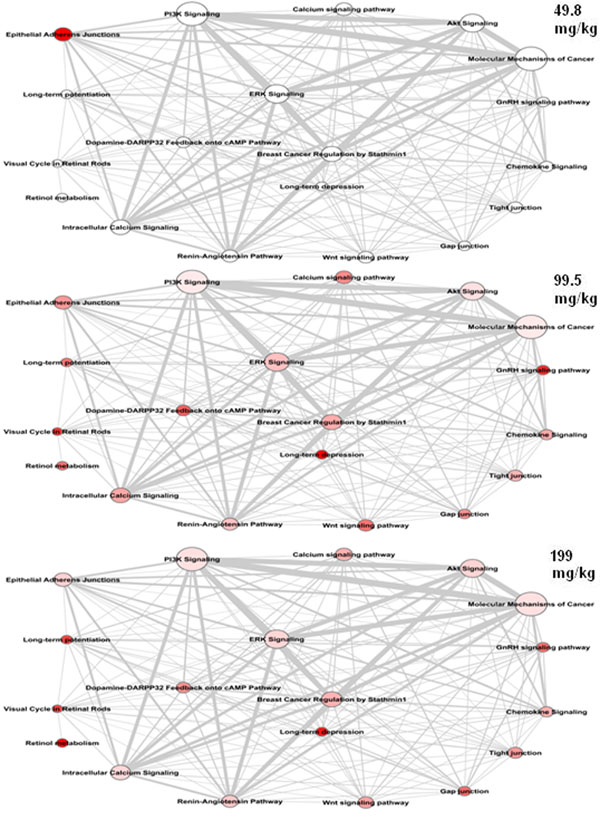
Figure 2.
Pathway merging network of top 20 enriched pathways affected by 2,4DNT treatment at each of the three doses. The network was derived from differentially expressed genes (DEGs) across all doses of 2,4DNT. The size of each node is proportional to the number of proteins in a pathway. The color of each node reflects the intensity of the DEGs in each pathway with darker shades of red indicating greater numbers of DEGs. The edge label width is proportional to the number of molecular entities shared by the connected pathways.

