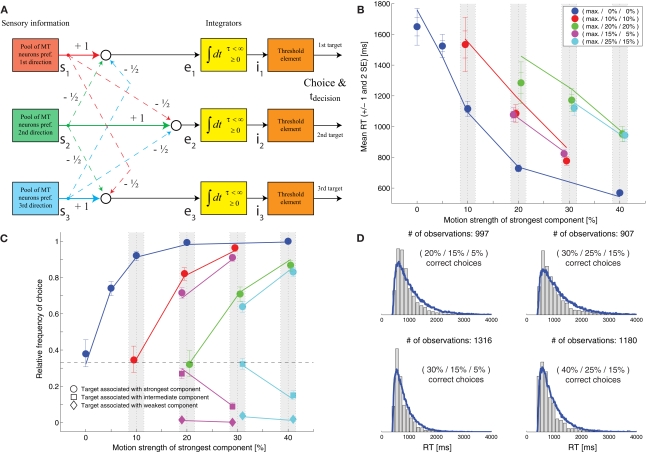
Figure 1.
Slightly leaky feedforward inhibition model. (A) Structure of the model. Solid lines indicate excitatory connections, dashed lines inhibitory connections. (B) Fit of the model (lines) to the mean response time data (symbols). The coherence of the strongest motion component is plotted on the horizontal axis. The color codes for the strengths of the other two components. Data points within the light gray bars, which would normally all be aligned with the center of the bar, have been shifted horizontally for presentation purposes to reduce overlap. (C) Comparison between the model's choice predictions (lines) and the behavioral data (symbols). The error bars indicate 95% confidence intervals. (D) Comparison between the model's predictions for some RT distributions (blue lines) and the behavioral data (gray histograms).

