Figure 12.
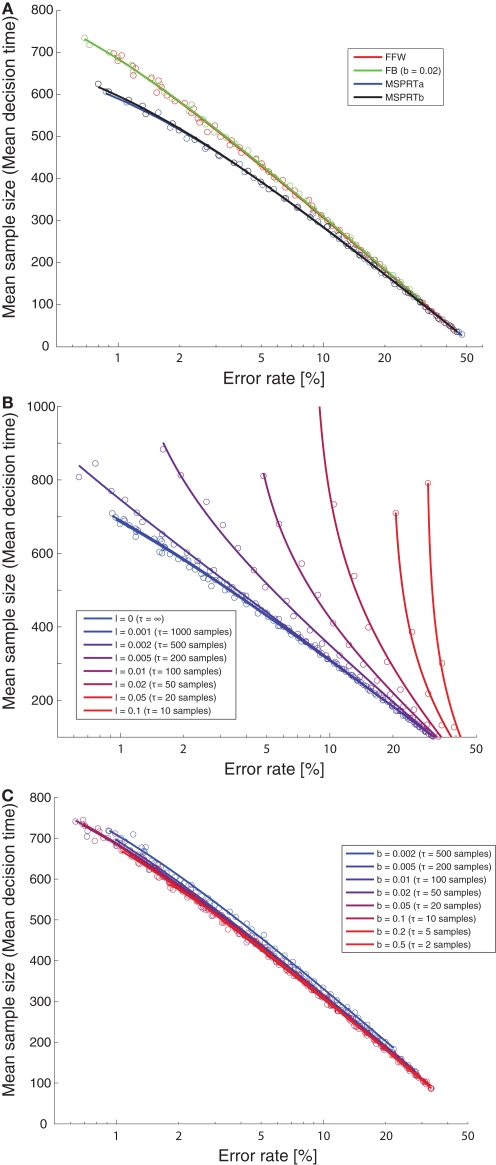
Optimality of decision mechanisms. (A) Mean sample size (decision time) as a function of error rate for different decision mechanisms. A feedforward inhibition mechanism (“FFW”, red) and a feedback inhibition mechanism (“FB”, green) are compared with MSPRTa (blue) and MSPRTb (black). The circles are the simulation results, the lines are all fits of the form mean sample size = α + log(β + γ error rate) (with α, β, and γ free parameters), which provided good empirical fits for all simulations. (B) Effect of leakiness of the integrators on optimality of the feedforward inhibition mechanism. The leakiness ranges from 0 (perfect integration; blue) to very leaky (integration time constant of 10 samples; red). As can be seen, the optimality quickly declines with increasing leakiness. See (A) for an explanation of the circles and the lines. (C) Effect of leakiness of the integrators on optimality of the feedback inhibition mechanism. The leakiness ranges from slightly leaky (integration time constant of 500 samples; blue) to very leaky (integration time constant of two samples; red). As can be seen, over a wide range of time constants, the optimality is insensitive to the leakiness of the integrators. See (A) for an explanation of the circles and the lines.

