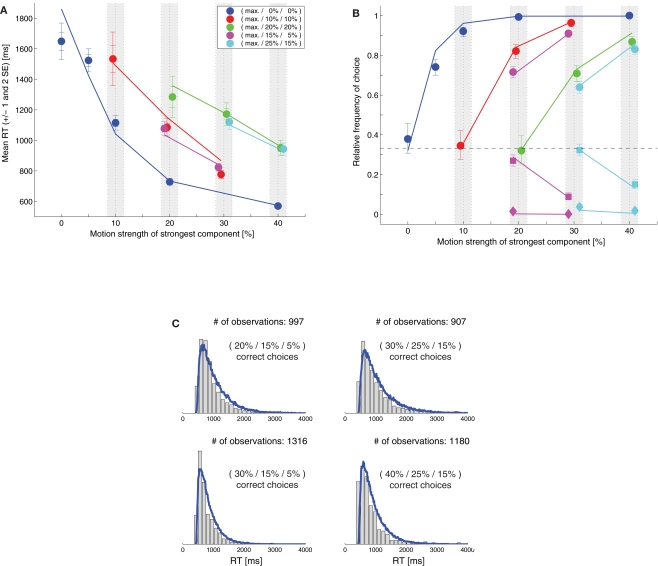
Figure 4.
Feedback inhibition model with scaling variance. (A) Fit of the model (lines) to the mean response time data (symbols). (B) Comparison between the model's choice predictions (lines) and the actual data (symbols). (C) Comparison between the model's predictions for some RT distributions (blue lines) and the behavioral data (gray histograms).

