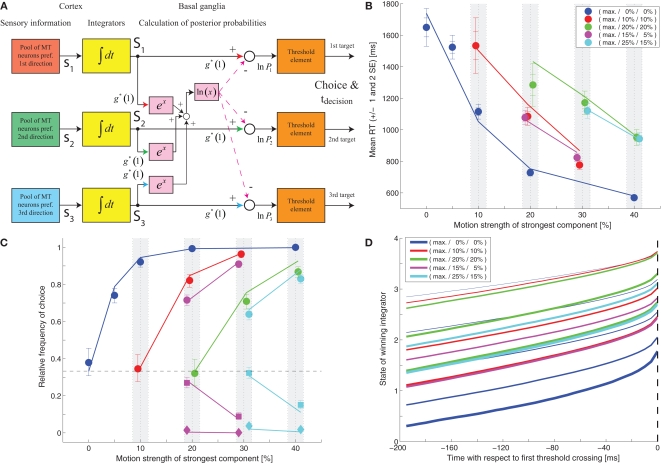
Figure 6.
Feedforward MSPRT model. (A) Structure of the model. (B) Fit of the model (lines) to the mean response time data (symbols). (C) Comparison between the model's choice predictions (lines) and the actual data (symbols). (D) Model predictions for the state of the winning integrator just prior to decision threshold crossing. Line width codes for the coherence of the strongest motion component (thicker = higher coherence), line color codes for the other two motion strengths. The integrator state at threshold crossing is very different for different combinations of motion coherence.

