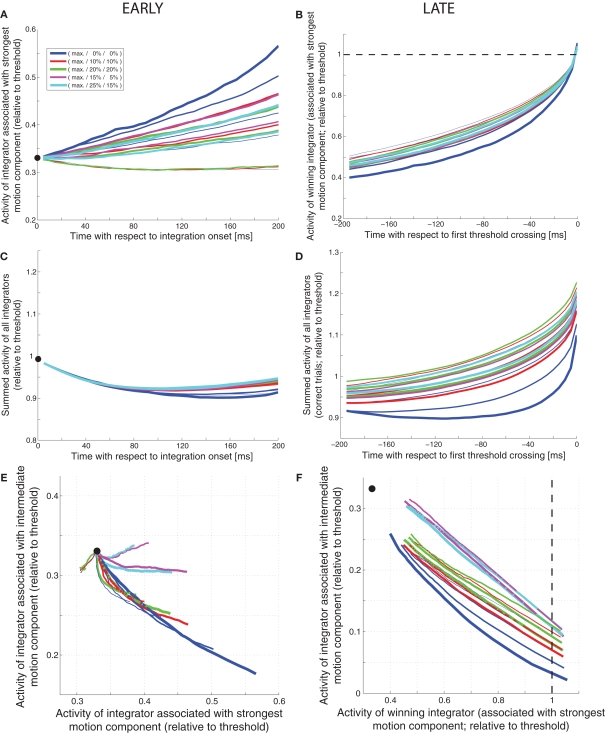
Figure 9.
Internal dynamics of feedforward inhibition mechanism (shown in Figure 1). (A) Expected activity (relative to threshold) of the integrator associated with the strongest motion component during the first 200 ms after integration onset. The thickness of the line represents the coherence of the strongest motion component (thicker = higher coherence), the color codes for the coherences of the other two components (see legend). The black dot marks the starting point of integration. (B) Expected activity of the integrator associated with the strongest motion component during the last 200 ms before threshold crossing on correct trials. The dashed line indicates the decision threshold. (C) Expected sum of the activities of all integrators during the first 200 ms. (D) Expected sum of the activities of all integrators during the last 200 ms on correct trials. (E) Expected movement through state space (states of the integrators associated with the two stronger motion components) during the first 200 ms. (F) Expected movement through state space during the last 200 ms.

