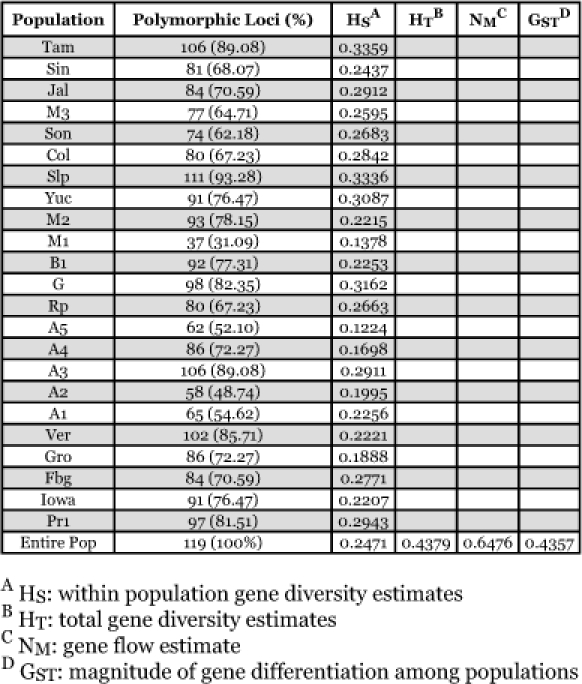
Table 3.
Gene diversity statistics estimated from AFLP data. The individual heterozygosity (Hs) indicates a lack of homogeneity; the total heterozygosity (HT) indicates high genetic diversity of all populations; the gene flow (NM) indicates a low level of gene flow; and the majority of genetic variation is within a given population (GST).

