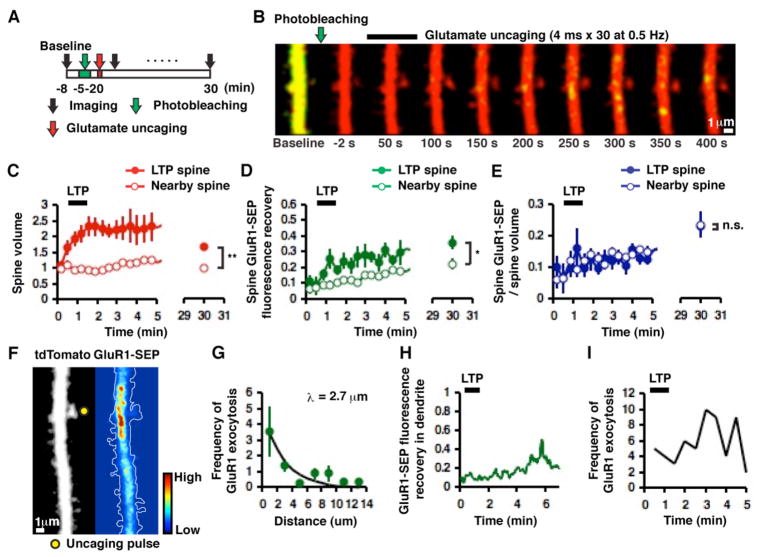
Figure 4. GluR1 exocytosis occurs primarily on dendrites during two-photon glutamate uncaging-evoked LTP and is compartmentalized to a stretch of dendrite.
(A) Experimental design (images acquired at ~2 sec/frame). (B) Example of time-lapse images of highly compartmentalized GluR1 exocytosis along with an increase in spine volume mediated by single-spine LTP. Note that spine enlargement precedes GluR1 exocytosis. (C) Mean changes in spine volume in potentiated (n = 9, 8 cells) and nearby non-potentiated (n = 8, 5 cells, **p < 0.01) spines. (D) Fluorescence recovery of GluR1-SEP in potentiated (n = 9, 8 cells) and nearby non-potentiated (n = 8, 5 cells *p < 0.05) spines after photobleaching dendrites. (E) Mean changes in spine GluR1-SEP/volume in potentiated (n = 9, 8 cells) and non-potentiated (n = 8, 5 cells, p = 0.96) spines. (F) Example of compartmentalized GluR1 exocytosis. Left panel shows the morphology of a hippocampal CA1 pyramidal neuron and right panel shows a pseudo-color-coded rate/intensity map of GluR1 exocytosis (two-photon laser pulse location indicated by yellow filled circle). These images were obtained by integrating over 200 time-lapse images acquired over ~7 min. (G) Frequency of GluR1 exocytosis within 5 min of glutamate uncaging plotted as a function of distance from a potentiated spine (binned by 2 μm, 8 cells). Exponential fit with a length constant λ = 2.70 μm. (H) Time-course of GluR1-SEP fluorescence recovery in dendrites next to the potentiated spine in B. Note the transient increase in the GluR1-SEP signal minutes following glutamate uncaging. (I) Frequency of GluR1 exocytosis after glutamate uncaging plotted as a function of time. The number of events was summed across 8 cells. Note the frequency of GluR1 exocytosis increases considerably after the last laser pulse of glutamate uncaging.

