Figure 1.
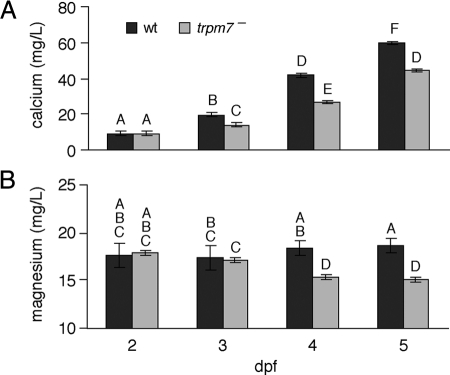
Total calcium and magnesium concentrations in trpm7 mutants. A and B, Calcium (A) and magnesium (B) levels are shown as least squares means ± se after controlling for batch-specific variation (n = 120 mutant and wild-type samples at stages 2–5 dpf). By overall ANOVA, calcium F(7,112) = 467 (P < 0.0001) and magnesium F(7,112) = 33.8 (P < 0.0001). Samples with the same letters are not significantly different by Tukey-Kramer honestly significant difference test (α = 0.05). wt, Wild type.

