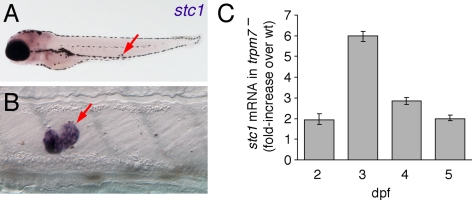
Figure 2.
Expression of stc1 and increased transcript abundance in trpm7 mutants compared with wild type (wt). A, Low-magnification view showing expression in CS (arrow). Purple coloration in head is background due to probe trapping. B, Higher magnification of CS. C, qPCR showing that stc1 mRNA is more abundant in trpm7 mutants at each stage examined. Values were normalized to β-actin and scaled relative to wild-type sibling levels of stc1. Error bars represent 95% confidence intervals; all P < 0.05 compared with wild-type levels.

