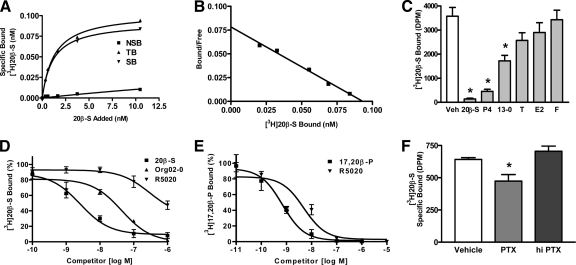
Figure 2.
Characteristics of progestin binding in G/T cells. A and B, Representative saturation analysis (A) and Scatchard plot (B) of [3H] 20β-S binding to granulosa and theca coculture plasma membranes. TB, Total binding; NSB, nonspecific binding; SB, specific binding. Kd = 1.7 nm 20β-S, Bmax = 0.0975 nm or 0.39 fmol/mg protein. C, Single point competition with 100 nm competitors for [3H] 20β-S binding to plasma membranes of G/T cell cocultures. Data represent means disintegrations per minute/50 μg protein ± sem, n = 3; *, P < 0.001 compared with vehicle (Veh) control by one-way ANOVA and Dunnett’s multiple comparison test. P4, Progesterone; 13-0, Org OD 13-0; T, testosterone; E2, estradiol-17β; F, cortisol. D, Competition of 20β-S, Org OD 02-0, and R5020 for [3H] 20β-S binding to G/T plasma membranes expressed as a percentage of maximum specific 20β-S binding. Competition binding curves were generated from the average of three experiments. Org 02-0, Org OD 02-0. E, Competition with [3H] 17,20β-P binding to an ovarian cytosolic fraction by 17,20β-P and R5020 expressed as a percentage of maximum specific 17,20β-P binding. Competition binding curves were generated from the average of three experiments. F, Effect of 1 μg/ml PTX or hiPTX on [3H] 20β-S binding to G/T cell plasma membranes. Representative results from multiple experiments are shown. Data represent means disintegrations per minute/50 μg protein ± sem; *, P < 0.05 compared with vehicle control by one-way ANOVA and Dunnett’s multiple comparison test, n = 3.

