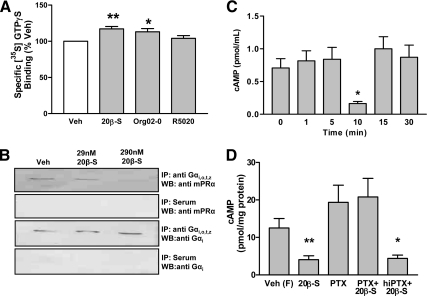
Figure 3.
G protein activation and cAMP signaling in response to 20β-S treatment. A, Specific binding of [35S] GTPγS to plasma membranes of Atlantic croaker G/T cells in response to 100 nm progestin. Data are expressed relative to control values (100%) and represent means ± sem; **, P < 0.001, n = 7; *, P < 0.05, n = 3 compared with vehicle (Veh) control by one-way ANOVA and Dunnett’s multiple comparison test. Org 02-0, Org OD 02-0. B, Representative blot of coimmunoprecipitation of mPRα by anti-Gαi,o,t,z and effects of pretreatment with 20β-S. C and D, Effects of treatments with 100 nm 20β-S on whole-cell cAMP levels. C, Time course of changes in cAMP after 20β-S treatment. Data represent means ± sem; *, P < 0.01, compared with 0 time point by one-way ANOVA and Bonferroni’s multiple comparison test, n = 13. D, Effects of pretreatment with PTX and hiPTX on cAMP levels in response to 20β-S treatment in forskolin-treated cells. Data represent means ± sem of log transformed data to remove variance inequality. *, P < 0.05; **, P < 0.001, compared with vehicle control treated with forskolin alone (Veh F) by one-way ANOVA and Dunnett’s multiple comparison test, n = 6. IP, Immunoprecipitation; WB, Western blot.

