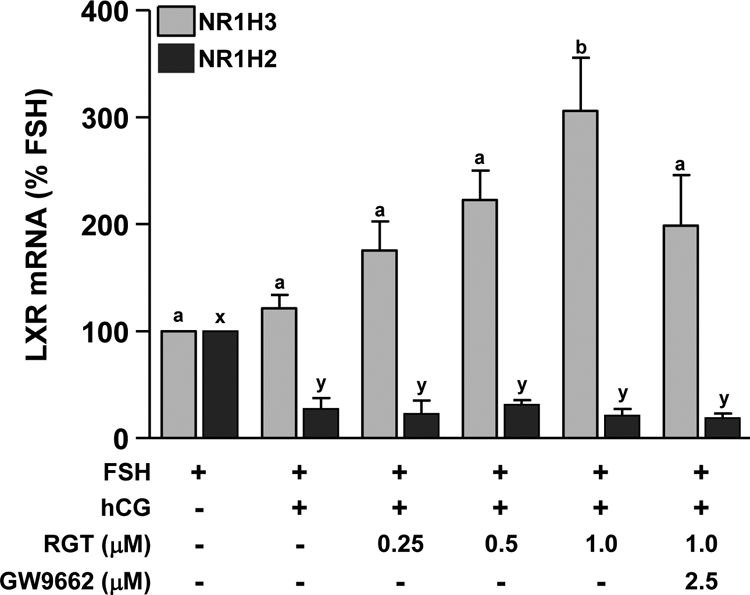
Figure 2.

Effect of PPARG agonist treatment on NR1H2 and NR1H3 mRNA expression during in vitro luteinization. Granulosa cells isolated before hCG as in Fig. 1 were plated in fibronectin-coated 24-well plates and treated with FSH to maintain the nonluteinized phenotype or FSH+hCG for 24 h to induce luteinization. The PPARG agonist RGT (0–1.0 μm) was added to cultures with or without the PPARG antagonist GW9662 (2.5 μm). NR1H3 (gray bars) and NR1H2 (black bars) mRNAs were measured by real time RT-PCR. Data are presented as mean ± sem. Bars with different lowercase letters are significantly different (n = 3; P < 0.05).
