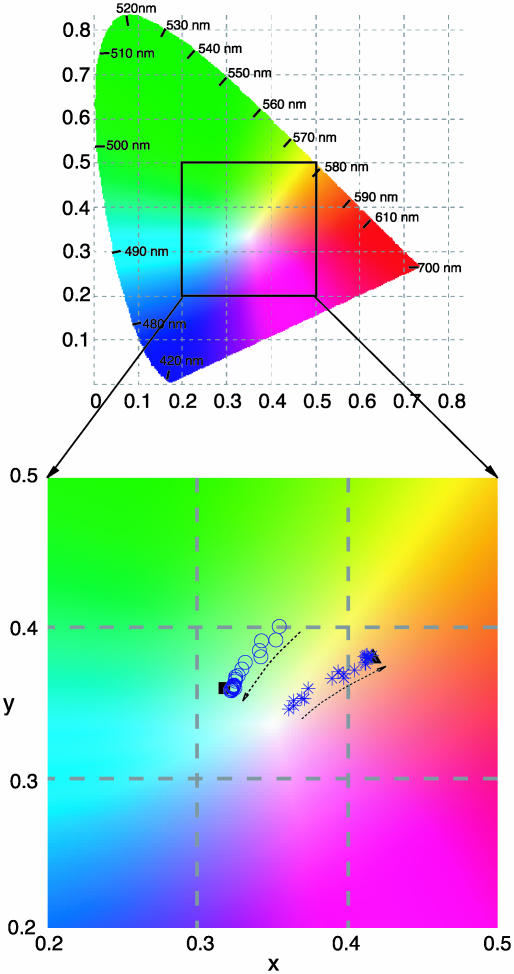
Fig. 3.
The mean of the probability distributions derived from the database [i.e., P(Ct |Cc, Nt)] in an example where Cc = [0.32, 0.36] (a greenish context whose chromaticity is indicated by the square symbol), compared to an example where Cc = [0.42, 0.38] (a reddish context whose chromaticity is indicated by the triangle); Nt varied from 1 to 25 in both cases, increasing in the direction indicated by the arrows. The mean values in the greenish and reddish chromatic contexts (circles and asterisks, respectively) are superimposed on a blow-up of the corresponding region of the 1931 CIE chromaticity diagram. See text for further explanation.

