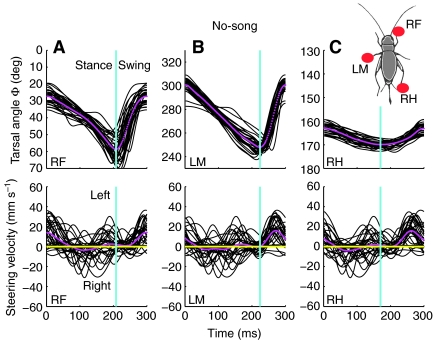
Fig. 3.
Tarsal angle (Φ) and steering velocity were superimposed and averaged over 30 steps of a typical walking trial during the no-song condition. They are shown in A–C for the tripod comprising the right front (RF), left middle (LF) and right hind (RH) tarsi. The red markers on the schematic cricket (right) indicate the tripod considered. Individual traces of angles are shown in black, average traces in magenta, and average time of the stance–swing transition is indicated by a vertical line (cyan).

