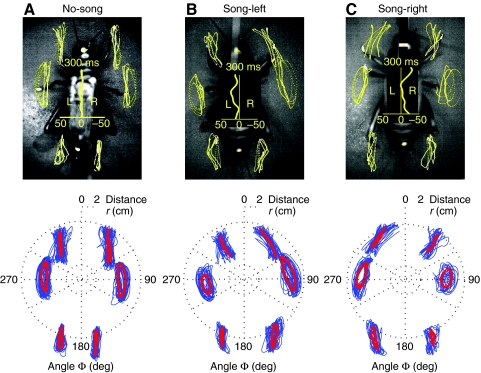
Fig. 5.
Video images and tarsal trajectories of female crickets walking on a trackball during (A) no-song, (B) song-left and (C) song-right conditions. Lower panels, tarsal trajectories and average steering velocity for a 2-s walking period. The extracted tarsal trajectories (blue) were plotted in polar coordinates based on tarsal distance (r) and tarsal angle (Φ). Mean tarsal trajectories were calculated by averaging and are superimposed in red.

