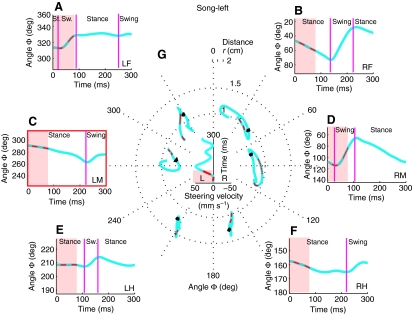
Fig. 6.
Tarsal trajectories of each leg for a single step during song-left. The left middle leg was used as reference for the stepping cycle (indicated in red). Outer diagrams (A–F) show the tarsal angle (Φ) for each leg. Pink shading indicates the presentation of the song and red dots indicate the occurrence of syllables. The transition between swing and stance phases is marked with vertical magenta lines. In the centre (G) the polar plot shows the steering velocity over the step, together with the tarsal trajectories of all legs. Black arrowheads indicate the movement direction of the tarsi and red dots indicate the timing of syllables.

