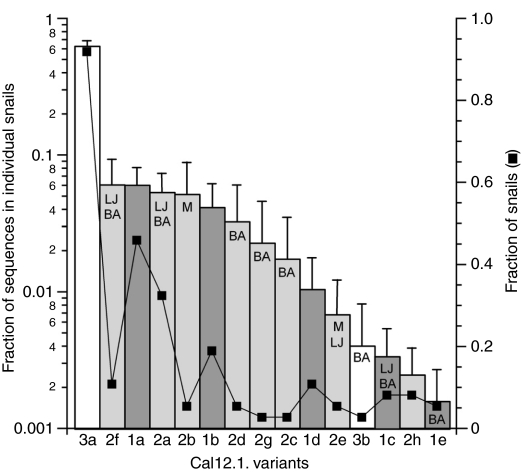
Fig. 9.
Expression of Cal12.1 transcripts in individual snails. An index of expression for each Cal12.1 variant (indicated on the x-axis) was computed as the mean (±s.e.m.) of fractions found in 37 individual snails. Letters in the bars indicate the locations where each isoform was detected: M, Monterey; LJ, La Jolla; BA, Bahia Asuncion; no label, all three locations. Squares indicate the relative number of snails in which each family member was independently identified. Cal12.1.3a is by far the most commonly expressed transcript; Cal12.1.1a and Cal12.1.1b are expressed at a much lower frequency. The number of sequences independently obtained with RT-PCR analysis from an individual snail varied from 19 to 56 (mean ± s.d.=35±9; total number of sequences=1295). Number of sequences and snails used to compute the plotted values did not include data from amplifications, which were repeated on six snails in the process of confirming various sequences.

