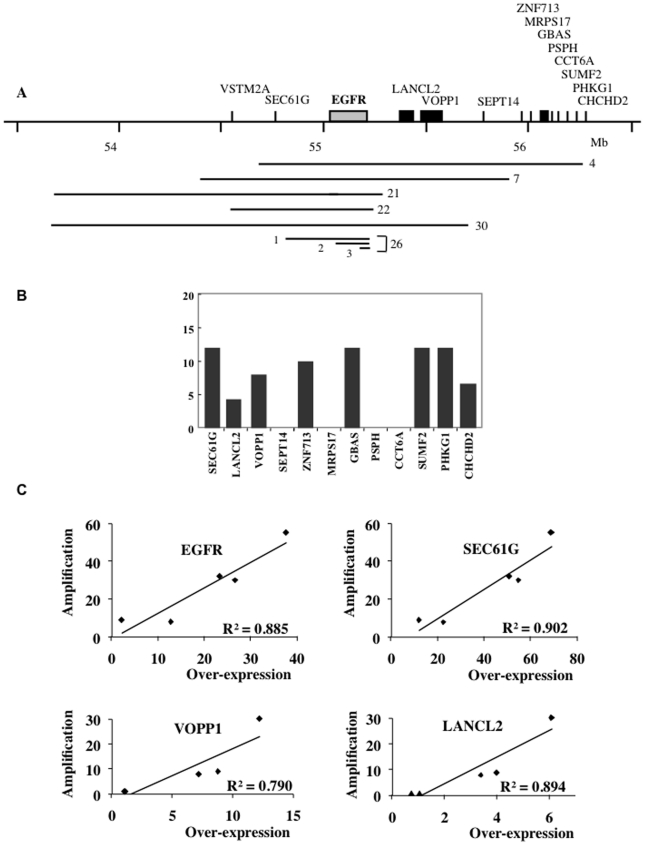
Figure 1. Relationships between gene copy number and mRNA expression in gliomas amplified for the 7p11–p12 locus.
Full-length names of the genes are listed in Supporting Information Table S1. A. Position of the genes co-amplified with EGFR. The extent of the amplified regions is mapped for each glioma. In tumour 26, 3 amplicons of different sizes were present. B. Over-expression of genes co-amplified with EGFR in tumour 4 analysed by RT-Q-PCR. The expression ratio (Re) was calculated by dividing the normalised expression measured in the tumour by the mean of the normalised expressions measured in the reference set of tumours. Genes SEPT14, MRPS17, PSPH and CCT6A are expressed neither in the analysed glioma nor in the reference set. C: Relationships between amplification and mRNA expression for genes amplified in several tumours. EGFR and SEC61G were amplified in tumours 4, 7, 21, 22 and 30; LANCL2 and VOPP1 in tumours 4, 7 and 30. Primers used for EGFR detected the full-length and the deleted (EGFRvIII) forms of the gene.

