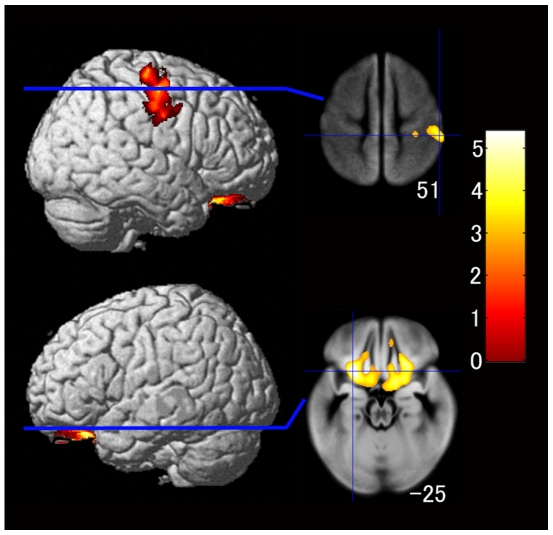
Figure 3. Gray matter regions with significantly larger volumes in the bread group as compared with in the rice group after adjusting for age, gender, socioeconomic status, average weekly frequency of having breakfast, and number of side dishes eaten for breakfast.
Details are the same as in Figure 2.

