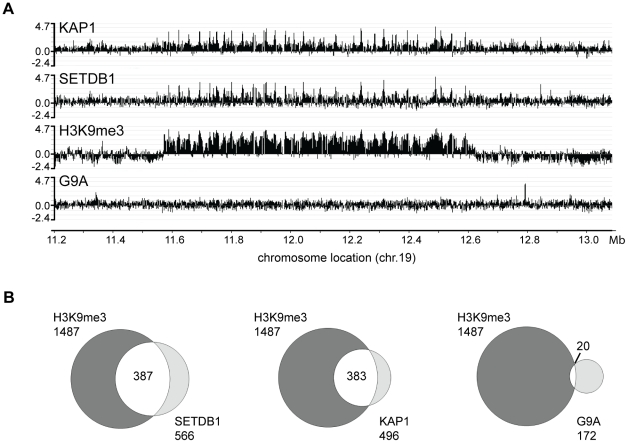
Figure 1. SETDB1, but not G9a, colocalizes with H3K9me3 on chromosome 19.
(A) ChIP-chip binding patterns of KAP1, SETDB1, H3me3K9 and G9a are compared at a zinc finger gene cluster on chromosome 19. The log2 (ratio) values reflecting the ChIP enrichments are plotted on the y axes and chromosomal coordinates are shown on the x axis. (B) Peaks were called using the ChIP-chip array data for SETDB1, G9a, and KAP1 using the Mayacamas peak calling program. The total number of peaks for each data set are shown; the intersection indicates the number of SETDB1, KAP1, and G9a peaks that overlap with the H3K9me3 peaks.

