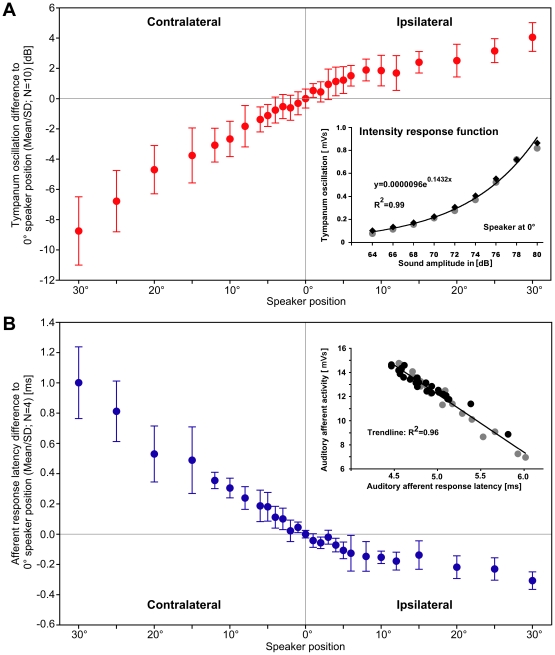
Figure 3. Characteristic plots of directionality.
(A): Amplitude changes of the tympanic membrane oscillations relative to the response at 0° speaker position. In the range of ±30° the response amplitude gradually increased by 4.1 dB for ipsilateral and it decreased by 8.8 dB for contralateral stimulation. (Inset A): The intensity response function of tympanic membrane oscillations for frontal sound stimuli presented at 64-80 dB SPL (gray, black: before and after directional test). (B): Changes in the latency of the summed afferent response relative to the latency at 0° speaker position. In the range of ±30° the response latency gradually decreased by 0.3 ms for ipsilateral and it linearly increased by 1.0 ms for contralateral stimulation. (Inset B): Correlation between auditory afferent response latency and afferent activity with a linear regression line fitting the data points. Each data point is mean response of 100 stimulus repetitions. Black dots represent data from directional tests. Gray dots represent data from frontal acoustic stimulation while the sound intensity was varied in 2 dB steps between 64 to 80 dB SPL. Each sound intensity was tested before and also after the directional test.

