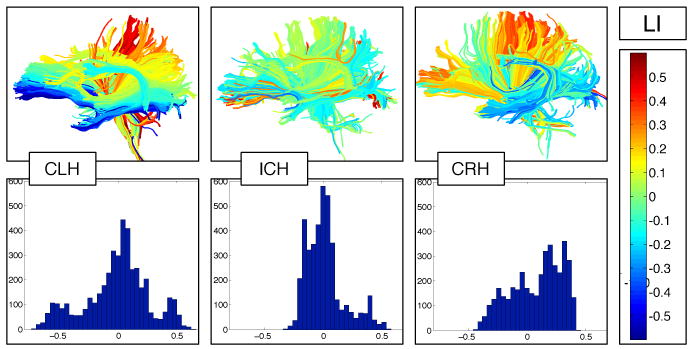
Fig. 1.

Fiber laterality indices and fiber laterality histograms in example subjects from each handedness group. Top row: individual subject fibers painted by their LIs, where blue and cyan are left-lateralized, red and yellow are right-lateralized, and green is not lateralized, i.e. it is symmetric. The inconsistent-handed subject, center, has relatively few asymmetric fibers as shown by the prevalence of green color. Bottom row: Fiber laterality histograms showing the distribution of LIs over all the fibers in the brain of each subject from the top row.
