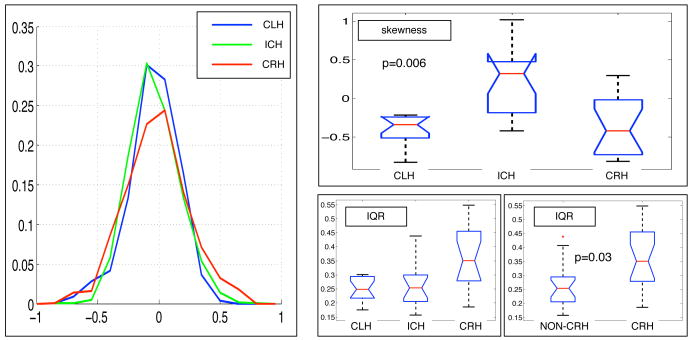
Fig. 2.
Differences in the fiber laterality index distribution across groups. Left: average fiber laterality histogram in the three groups (bin counts were normalized within subject by number of fibers, then averaged across subjects in the group at each bin location). Note the tails of the green inconsistent-hander distribution are most symmetric about 0, and the red consistent-right-hander curve appears wider. Right (box-plots): A significant skewness difference was measured between inconsistent handers and the other two groups (top). The interquartile range, bottom, in the three handedness groups was not significantly different (p = 0.098), but it did differ if CLH and ICH were combined and compared with consistent right handers.

