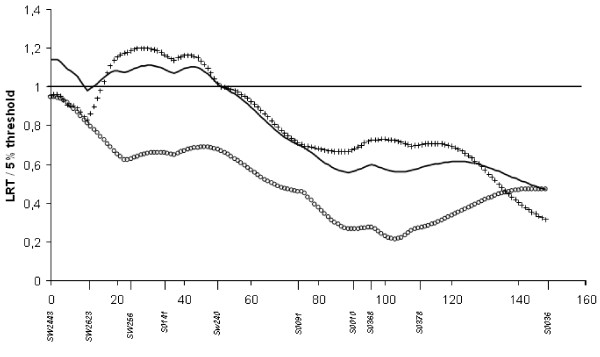
Figure 4.
QTL underlying BFT on SSC2 for the three studied pedigrees. The solid line gives the result for the combined pedigree, the circled line for the French pedigree and the crossed line for the Dutch pedigree; for each analysis, the LRT is presented in proportion to the 5% threshold on the chromosome

