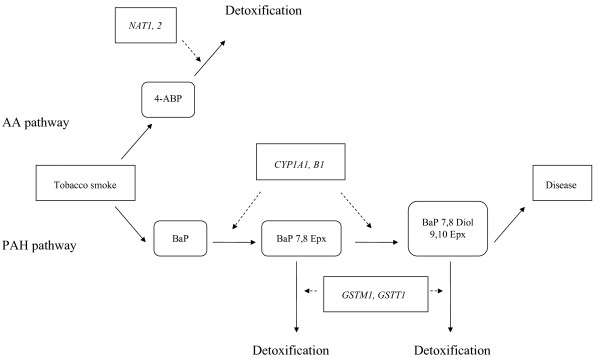
Figure 1.
Directed Acyclic Graph of the proposed pathways. Measured quantities, i.e. smoking, disease status and genotypes are represented by angular boxes, intermediate metabolites by rounded boxes. Solid arrows mark the metabolic pathways whereas broken arrows indicate the influence of the polymorphisms.

