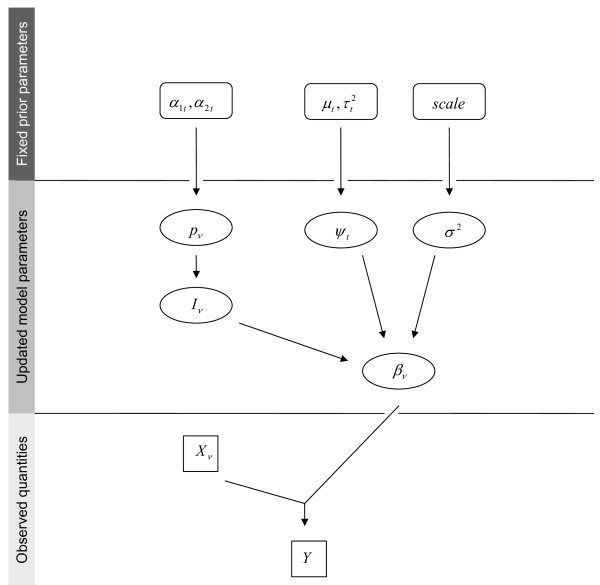
Figure 2.
Directed Acyclic Graph for BMA and its parameters. Boxes represent observed quantities, ovals parameters to be updated over the course of MCMC, and rounded boxes fixed meta-parameters. Y denotes the dependent variable, and ν indexes the sets X of independent predictor variables and β of corresponding estimates. I indicates inclusion of the νth variable and is Bernoulli-distributed with parameter pν, which, in turn, follows a beta distribution with parameters (at, bt) depending on the interaction level t of the variable. The variance of the coefficients βν is modeled by a residual variance term σ2 following a half-Cauchy prior, and a variance inflation factor ψt depending on the interaction level and following a log-normal distribution with mean μt and variance τt.

