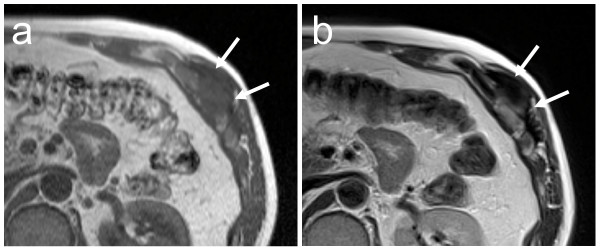
Figure 3.
Axial MRI of the chest wall after treatment with tranilast. The tumor on T1-weighted image (a) is smaller than that seen on his first visit (shown in Figure 1(a)). The proportion of low-signal intensity area on T2-weighted image (b) is larger than that seen on his first visit (shown in Figure 1b). Arrows indicate the tumor.

