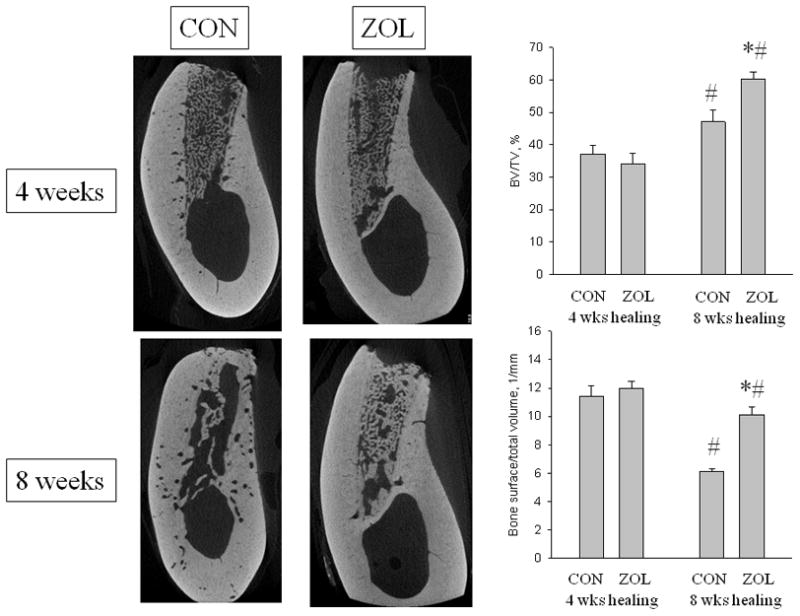
Figure 2.

Micro-computed tomography assessment of the extraction site. Representative images through the center of the extraction socket in control (CON and zoledronic acid-treated (ZOL) animals after either 4 or 8 weeks of healing. After 4 weeks the sites appear similar in the two groups while after 8 weeks there is clear morphological difference. Three-dimensional analysis of the entire socket region support these qualitative images by showing that after 4 weeks of healing there was no difference in bone volume/tissue volume (BV/TV, %) or bone surface/total volume between the two groups. After 8 weeks of healing, BV/TV was significantly higher in both treatment groups compared to the 4 week time-point yet was higher in ZOL compared to CON. Bone surface/total volume was significantly lower at 8 weeks compared to 4 weeks in both groups, with ZOL significantly higher than CON. p < 0.05 versus 4 week time-point within group (#) or versus CON-treatment within time point (*).
