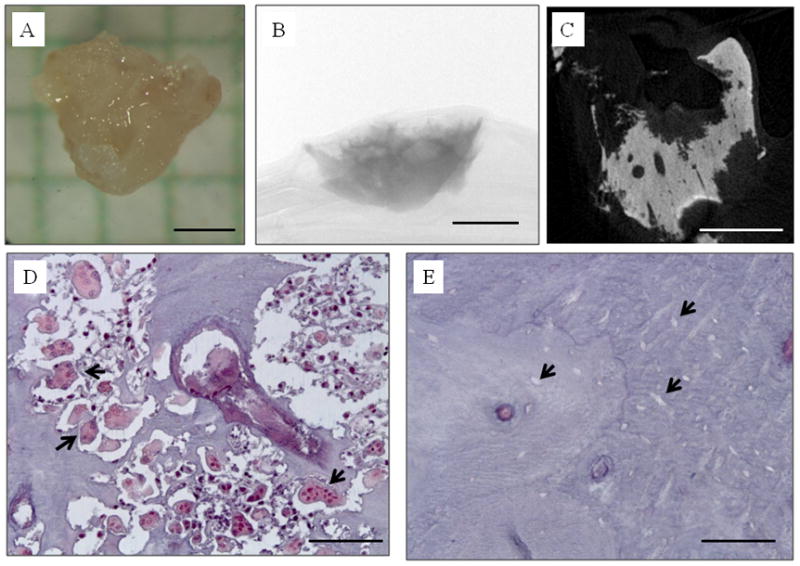
Figure 5.

The exposed bone in the zoledronic acid-treated animal eventually manifested a sequestrum which was removed from the soft tissue mucosa at the extraction site. (A) photograph; (B) two-dimensional micro CT image through the center of the sequestrum showing highly scalloped surfaces; C) two-dimensional micro CT projection image of the entire specimen; D) photomicrograph of histological section through the sequestrum stained with tartrate-resistant acid phosphatase (TRAP) to visualize osteoclasts (select, but not all, osteoclasts identified with black arrowheads); E) photomicrograph of histological section through the sequestrum stained with TRAP showing empty osteocyte lacunae (select, but not all, empty osteocyte lacunae identified with black arrowheads). Scale bars = 1 mm for A–C, 100 μm for D and E.
