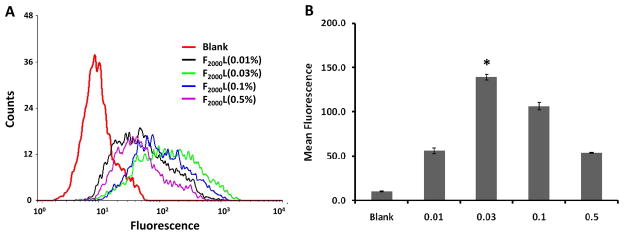
Figure 2.
Cell association of FTLs of varying FA-PEG(2000)-DSPE mole ratios with KB cells. Cells were incubated with liposomes labeled with FITC-DSPE and containing Folate-PEG(2000)-DSPE at either 0.01, 0.03, 0.1, or 0.5 mole ratio for 3 hours at 37 °C and analyzed by flow cytometry. A. Flow cytometry spectrum. B. Mean fluorescence of formulations. Data shown as average ± standard deviation of at least two measurements. * Statistical significance (p < 0.05) between cells treated with F2000L(0.03) and other F2000L groups as measured by ANOVA followed by Student-Newman-Keuls post-hoc test of the geometric mean of the fluorescence.

