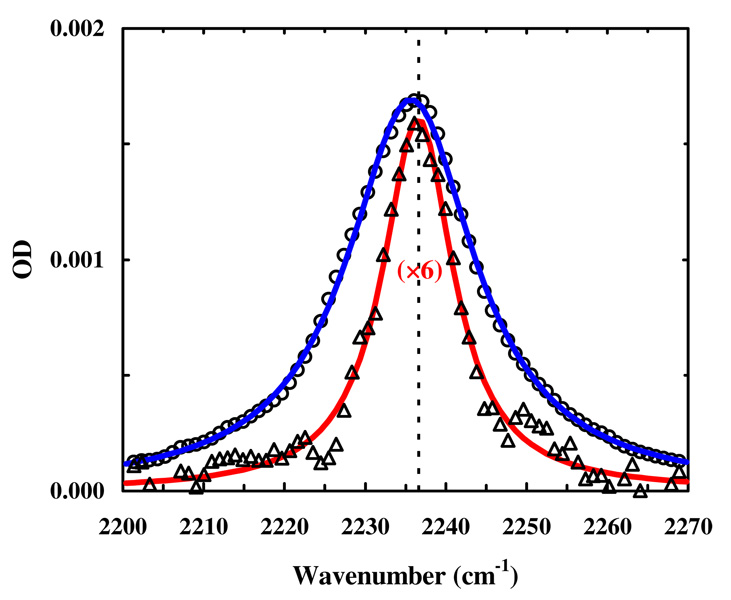
FIGURE 2.
The C≡N stretching band of the nitrile-labeled human calmodulin-like protein (in 50 mM HEPES buffer, pH 7.4) in the absence (open circles) and presence (open triangles) of Ca2+ (30 mM). The protein concentrations were approximately 1–2 mM (blue) and 200 µM (red), respectively. The solid lines are respective fits of these data to a Lorentzian function and the thin dashed line indicates the peak position of the nitrile band of probe 1 in water.

