
Figure 2.
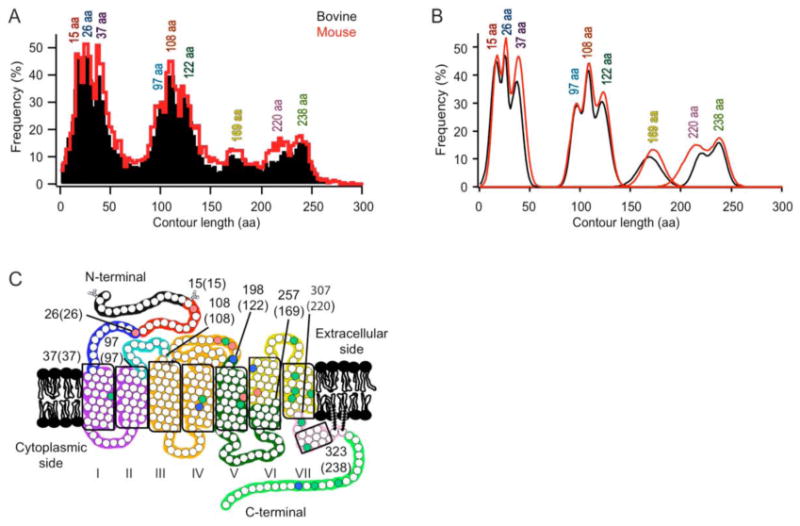
Classification of force peaks. (A) Frequency distribution of contour lengths determined from WLC model fitting of F-D curve peaks. The fitting of each peak of every F-D curve obtained at each speed is represented for bovine (black, n = 12,520) and mouse (red, n =9,830) rhodopsin. A bin size of 3 amino acid residues was used. (B) The histograms in (A) were analyzed by a Gaussian function to determine major peaks and their contour lengths. The most probable position and the standard deviation of each of the nine major peaks detected in the frequency distribution of contour lengths from either bovine (black) or mouse (red) data were estimated using a Gaussian function (Table S1). (C) The most probable contour lengths of each major peak were used to determine the corresponding structural segment in the receptor structure. Each structural segment is colored differently on the secondary structure of rhodopsin. The boundary amino acid residues for each segment are indicated with the corresponding contour length in brackets. The naming of each structural segment is given in Table 1. Conserved (green), semi-conserved (blue), and non-conserved (red) residues are indicated.